Void the Current Tax Roll? Nottage Debunks Alternative Facts
- Monday, 20 March 2017 08:03
- Last Updated: Monday, 20 March 2017 08:21
- Published: Monday, 20 March 2017 08:03
- Brian Nottage
- Hits: 6608
 Since Joanne Wallenstein wrote her article with my analysis, I've gotten a lot of feedback, some good suggestions/critiques and some...not so helpful. So I wanted to update and extend some of what I did.
Several people noted it might not be fair to compare the 2016 post BAR/SCAR roll to the same for 2015. One person, Jane Curley, made this case particularly forcefully in a letter to the editor of the Scarsdale Inquirer helpfully titled "Lies, and the Lying Liars Who Tell Them" about six of the 185 sales I included that she thought fell into that category:
Curley said,
"In actuality, only about six of the sales were incorrectly included. However, including them introduces bias into the analysis and that is very, very bad. That said, this happens all the time, usually innocently. However, once something like this is identified, it needs to be acknowledged. When you don't acknowledge it that is the statistical equivalent of a lie."
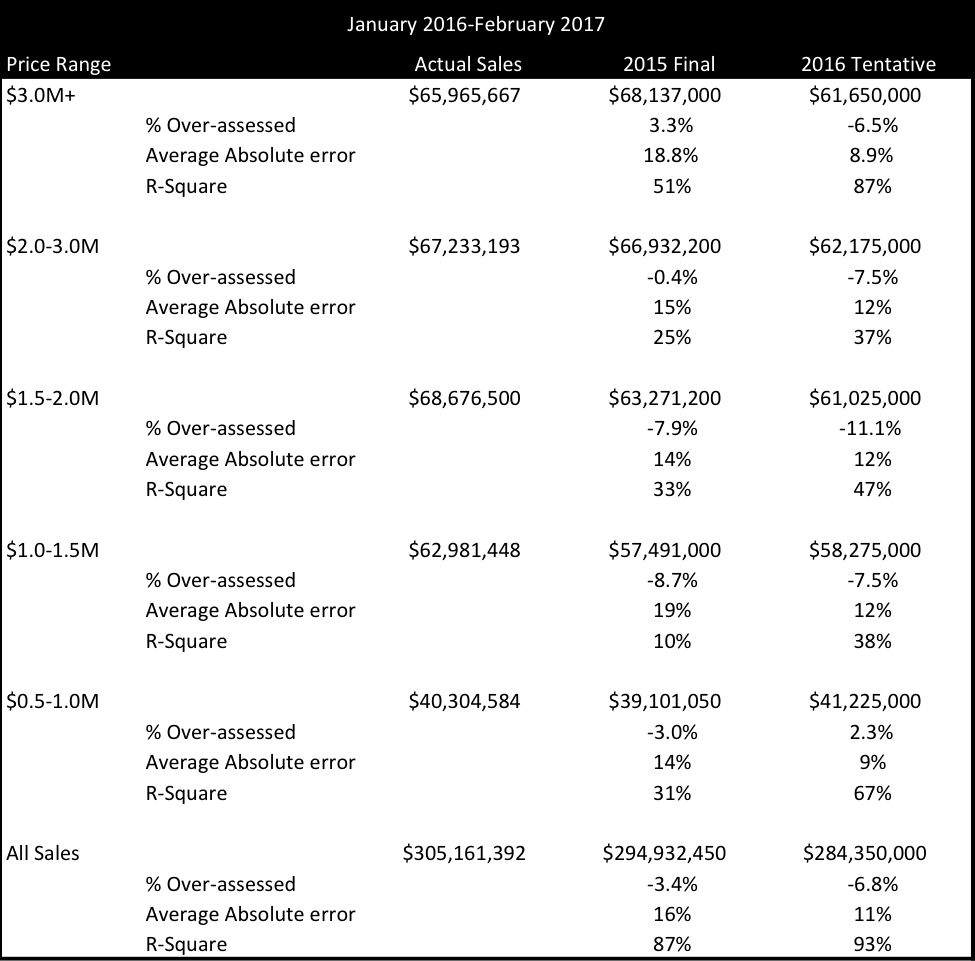
I'm not a fan of someone implying I'm dishonest, especially when I was fully transparent with the data and when the argument they're making is both so easily tested and so self-evidently unlikely to change any results (6 out of 185. Seriously?). So I redid the analysis with the 2016 tentative roll versus the final roll I'd used previously. You can see the results in the table below. If you're keeping score at home, nothing changed (several commenters pointed out as much to Curley, but in fairness to her, perhaps she was too busy composing her "lying liars" letter to run the numbers). And contra Mayra Kirkendall-Rodriguez's assertion that "Nottage's analysis was not validated nor peer reviewed. Several quants have already discredited his work" no such thing has happened. Statistician Michael Levine said in the last trustees meeting—at which people like Bob Harrison screamed about my "bogus analysis" and complained that my assessment went down—that mine was a valid exercise and that he found similar statistical results (I want to stress that he does not extend his conclusions to saying what roll should be used). It is surprising to me that everyone has had the data for this long and yet no one has come back with substantive quantitative rebuttals.

As an aside, I'm further amazed that people think someone's assessment going down is evidence that they're biased. I'm particularly amazed because some of the people making that argument also saw their assessments go down! It would be helpful for someone to make a cheat sheet of when a lowered assessment indicates insuperable bias versus when it indicates selfless public virtue. Asking for a friend.
In the same letter to the editor, Curley tries to explain why the stats may look as they do: "Finally, during the past year or two, the prices of Scarsdale's more modest homes seem to have gone up more significantly than the prices of higher end properties. This is a very happy coincidence that could just as easily have gone the other way."
Sooo... the 2016 roll only looks good because changes in housing market conditions have made it more representative? Well apart from that little fact Mrs. Lincoln, how was the play? I'm no lawyer, but I would hope that the Article 78 plaintiffs don't intend to argue that market reality (sales) has somehow unluckily conspired to make the 2015 roll look less accurate and that looking at prices on the ground today is somehow less relevant than looking at prices in 2013 which the Tyler valuations was derived from (this latter argument has actually been explicitly made). If market forces have moved higher-end homes down and lower end homes up, how would a fair assessment roll not reflect that, you know, kind of important fact?
But I wanted to delve further. Another argument made is that while 2016 may be more accurate, it is biased to high-end homes. That argument is actually right. It is biased. But the Tyler assessments were biased toward lower-end homes. Moreover, both underassess homes between $1.0-3.0M (hence the fact that both rolls would have needed an equalization ratio).
So if we have opposite biases, can we make any conclusions? Here, the inferences get muddier, but it is helpful to run some additional assessment ratios.

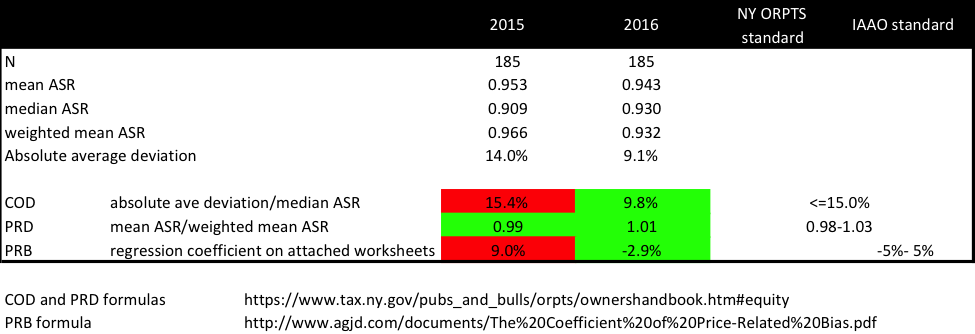
In the table above, I calculate the coefficient of dispersion (COD), price-related differential (PRD), and the price-related bias (PRB). All these are calculable from the posted dataset and I've included documents that show the steps in the table footnoted. A key critique of using just the COD and PRD is that they are simplistic and biased. The PRB is the new hot thing that assessor organizations like the IAAO are pushing (NY doesn't require it but some other states do). It measures the percentage change in assessment ratios as values double; a positive number implies overassessment at higher-priced homes and a negative number implies underassessment at higher-priced homes. In the table, I've included acceptable ranges of each from NY ORPTS and IAAO as I understand them.
As with the goodness of fit data, these results surprised me. The 2016 roll "passes" all three, while the 2015 "fails" two of three. Most telling is the PRB as it is constructed to let an assessor quantify how much progressivity or regressivity there is. At least as measured here, the bias toward lower-priced homes in the 2015 roll (9%) is three times larger than the 2016 roll's bias toward higher-priced homes (-3%).
So Tyler overassessed the high-end, Ryan overassessed the low end, both underassessed the middle (most of the village), but the PRB shows Tyler's bias was larger, while the COD shows the Tyler results are less accurate, at least as measured by the last year of sales.
These ratios don't conclusively prove that one roll is more equitable (or rather less unequitable) than the other. But it is surprising how relatively well the 2016 roll comes out, with multiple tests and slices of the data. I did similar analyses for sales just in the last half of 2016 (on the suspicion that Ryan might have somehow seen listings and adjusted his data accordingly). I did the analysis by lopping off the $3M+ range, Tyler's worst. While the absolute numbers changed (as you'd expect), the directional results were remarkably robust.
Why is this the case? I'm not completely sure. I suspect Ryan partly did get lucky: the market moved his way, as it has in all of Westchester County, but that counts. I also think Tyler's comp method introduced volatility relative to the sort of pure market model Ryan used. Tyler also has many more neighborhoods than Ryan leading to more cases of similarly-located homes having wildly different values. Both revals generated hundreds of challenges so each had problems.
But whatever the case, the question before the community is not whether Ryan did a great job or fulfilled his contract. The question is whether the evidence justifies taking the extraordinary measure of voiding an existing assessment roll to go back to one that, as measured by IAAO standards, is less reflective of the current market and which will potentially be even more unfair to a different group of people. I don't think such evidence has been presented. Accordingly, I don't think the village should countenance either rolling back to 2015 or settling with the Article 78 plaintiffs. We should look toward the next revaluation to fix the shortcomings of both Tyler and Ryan.
If you'll indulge me, I'll end on a personal note. The personal and often nasty nature of many of the attacks I've experienced over the past few days in multiple venues has been eye opening. People point to my membership on the CNC as though agreeing to run in a neighborhood election two years ago—a process that hundreds of our neighbors have gone through—somehow makes me the equivalent of a political machine insider. Well I'm no insider (I'd wager none of the trustees know me from Adam), but I'm proud to have served with CNC volunteers whom I hadn't known, but who spent many hours not just selecting candidates but encouraging as broad and diverse a set of people to put themselves up as candidates. I hope that we as a village never reward those who scream the loudest, who seek to pit people against each other the most, and who resort to vicious attacks when challenged.
Brian Nottage, PhD, CFA


